Optimize Your Business Website with Heatmaps: Why They Are Necessary
Table of Contents
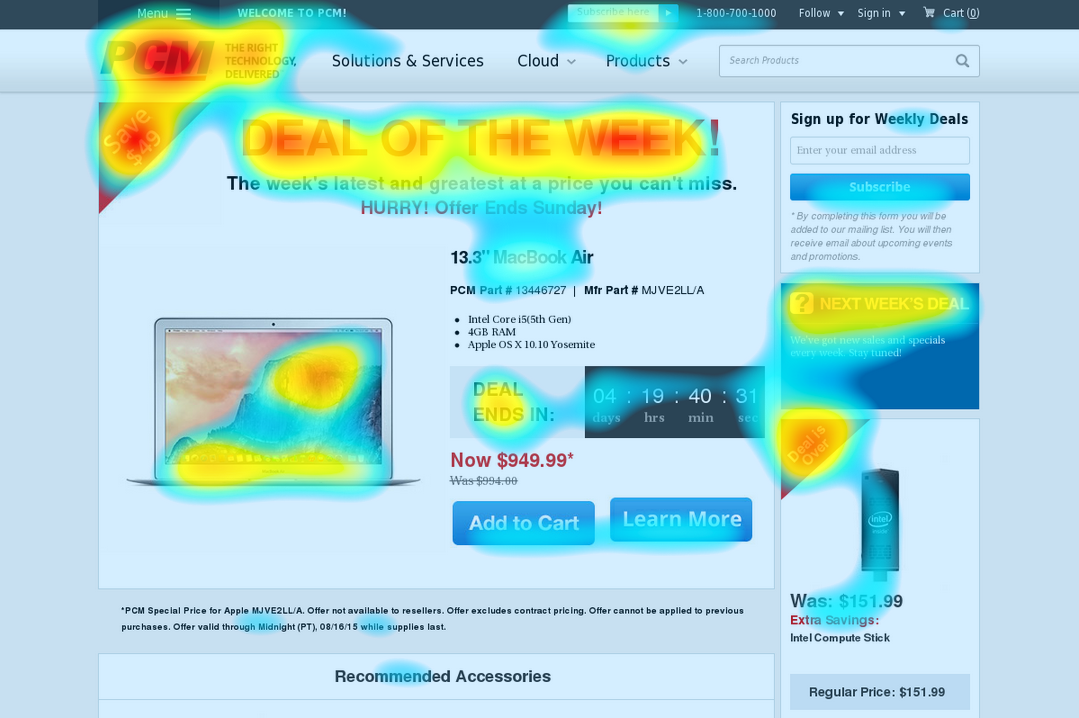
Heatmaps are an indispensable tool for understanding and improving the performance of your business website. These software solutions provide a colored representation of the most interacted (hot) and less interacted (cold) elements on the site.
What Is a Website Heatmap?
A website heatmap is a data visualization tool that helps businesses understand how specific pages on their site perform.
In simpler terms, a website heatmap is a graphical representation of data in the form of a chart or map, using different colors to indicate various data sets and values.
Heatmaps use a color spectrum from warm to cool to display the performance of a web page, with the warmer color indicating higher visitor engagement and the cooler color indicating lower engagement.
See to Improve
Heatmaps provide a clear view of what needs to be optimized. By observing where users click, scroll, or ignore on individual pages, you gain a detailed understanding of what to change, what to subject to A/B testing, and what to improve to offer users the experience they deserve.
Optimize and Refine Your Site
Heatmaps allow you to assess whether users reach important content, follow key links, buttons, and calls-to-action, or encounter issues while navigating from different devices. Applying heatmaps to critical business pages, such as the homepage, product pages, and checkout, ensures consistently excellent user experiences.
Greater Understanding of Users
Heatmaps tell the perfect visual story of what happens on individual pages, but they don’t stop there. Together with four other powerful tools in Hotjar, they help delve into where and for how long people struggled or got confused, providing real-time feedback as they navigate your site.
Types of Website Heatmaps
There are five main types of website heatmaps: Heatmap, Clickmap, Scrollmap, Mouse Tracking Heatmap, and Eye-Tracking Heatmap.
Heatmap
Heatmaps help gather insights into visitor behavior, enabling website customization to meet user expectations.
Clickmap
Clickmaps indicate which parts of the web page are clicked more or less, helping identify gaps in navigation.
Scrollmap
The Scrollmap is a visual representation of visitor scroll behavior, indicating how far users scroll down the page.
Mouse Tracking Heatmap
This heatmap indicates areas where visitors position the cursor more frequently, providing insights into what attracts attention.
Eye-Tracking Heatmap
This heatmap, based on the length and frequency of gaze fixation, shows the most attractive elements of a page, following the movement of the visitor’s eyes.
Why Use a Website Heatmap?
Traditional quantitative user analyses provide only the number of visitors and conversions without explaining exactly what happened during these two steps. Heatmaps address this gap, offering qualitative insights into visitor behaviors.
Measure Website Performance
Heatmaps instantly highlight key site issues, providing information on how users interact with the page.
Simplify Numeric Data
Heatmaps complement numerical analyses, representing data in an easily understandable way. At a glance, you can identify performing areas, those needing improvement, and those requiring a redesign.
Read Visitors’ Minds
Heatmaps allow you to make changes that reflect visitor expectations. They track exactly how visitors behave on the site, providing meaningful insights and practical actions.
Optimize Website Conversion Rate
All these benefits contribute to website optimization, improving user experience and increasing the conversion rate. Heatmaps are an essential component of Conversion Rate Optimization (CRO), providing qualitative data for improvements.
Advanced Insights to Leverage Conversion Opportunities
Combining heatmaps with other CRO tools, such as Google Analytics, A/B testing, and session recordings, provides a comprehensive view of visitor behavior and conversion opportunities.
How Does a Website Heatmap Work?
Now that you understand the benefits of heatmaps, let’s explore how to set them up and use them to obtain visitor behavior data.
1. Define Objectives
Every web page has a final goal. Identifying the problematic area to address is crucial for defining heatmap objectives.
2. Choose the Right Tool
Choosing a suitable tool is crucial. Ensure it allows customization of sample traffic, user segmentation, and in-depth data analysis while staying within your budget.
3. Configure Heatmaps
Once you’ve identified the problem and selected the tool, start configuring the heatmaps. Determine the type of heatmap that best suits your objectives.
4. Analyze Results
After the sampling period, analyze the results. Look at the color concentration and evaluate the performance of each section of the page.
5. Optimize the Site
Based on heatmap data, make necessary changes. These may range from small adjustments to radical changes in the site structure.
6. Test Variations
If possible, conduct A/B tests on the implemented variations. This helps confirm the effectiveness of changes and implement the winning version.
7. Deploy Improvements
Once validated, implement the changes on the site. Heatmaps are a dynamic tool, and continuous iteration consistently improves user experience and site performance.
Heatmaps are an essential element for understanding, optimizing, and enhancing the user experience on your business website. Use them to gain a detailed understanding of visitor behavior and drive targeted changes that will lead to a more effective and engaging site.